Procdot Guide
Overview
Procdot is a tool that allows you to visualize some of the information you get from a saved Process Monitor CSV file.
To start Procdot click on the Procdot link on your desktop.
Step 0: Collect Events with Process Monitor
The very first step is to make sure you've got some data to visualize. To do this use Process Monitor to gather events on the malware you're analyzing.
Note
Procdot can really slow down if you give it a lot of events to analyze. Using Procdot effectively, often requires you to flex those Process Monitor filter muscles.
It's also a good idea to drop filtered events
Step 1: Configure Process Monitor Output
Procdot is really picky about the format of the saved Process Monitor CSV file, so before creating the CSV file you first need to make sure Process Monitor is configured properly.
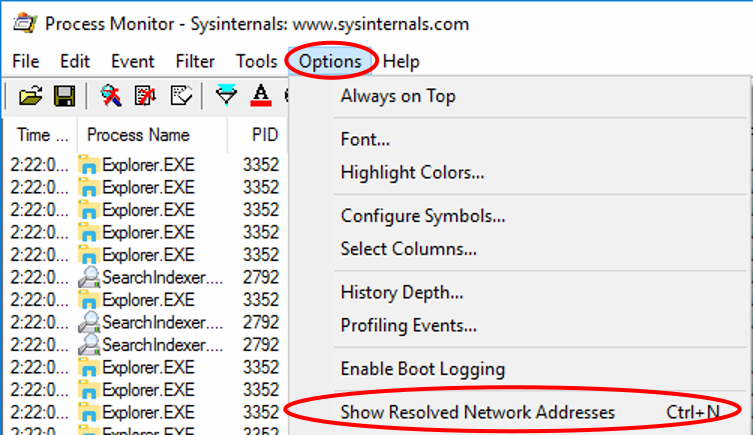
Step 1.1: Don't Resolve Network Addresses
Make sure that Show Resolved Network Addresses is unchecked. To do this, click on Options. If there is a checkbox next to Show Resolved Network Addresses, click it to remove the checkbox. If there is no checkbox, then you don't need to do anything.
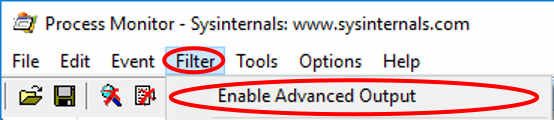
Step 1.2: Disable Advanced Output
Make sure that Enable Advanced Output is unchecked. To do this, click on Filter. If there is a checkbox next to Enable Advanced Output, click it to remove the checkbox. If there is no checkbox, then you don't need to do anything.
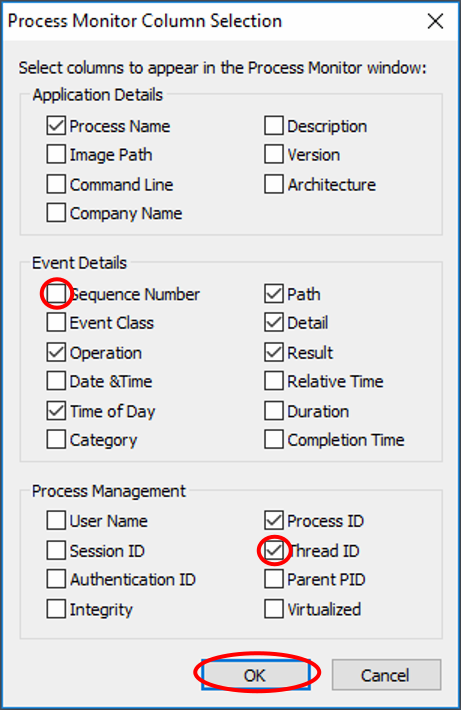
Step 1.3: Configure Displayed Columns
Procdot will complain if the Sequence Number column is displayed, and the Thread ID column is not.
To configure the display options click Options > Select Columns.
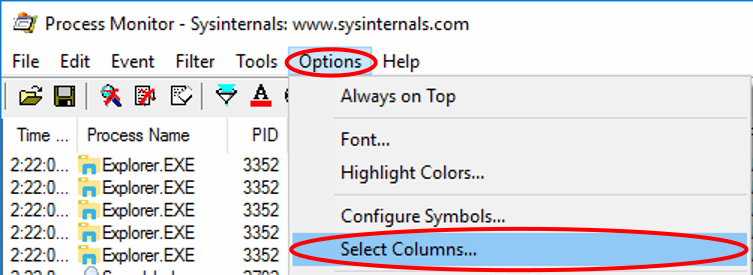
Under Event Details make sure the Sequence Number box is unchecked. Under Process Management make sure the Thread ID box is checked.
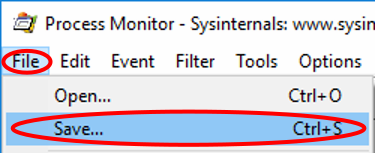
Step 2: Save Process Monitor CSV File
To save the events in Process Monitor to a CSV files, click File > Save, or hit Ctrl+S.
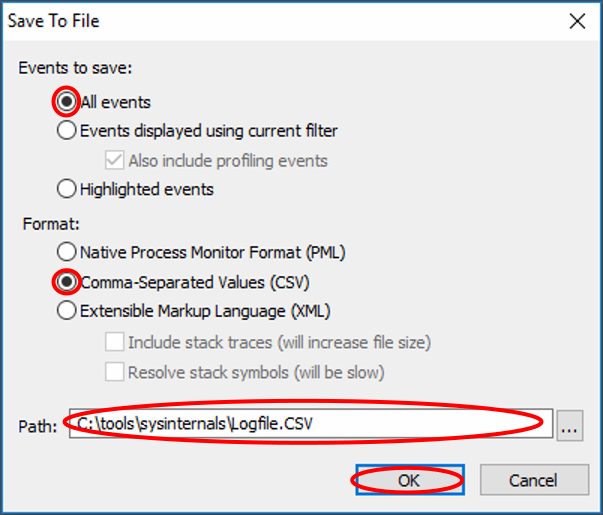
Under Events to save click the radio button next to All events. Under Format click the radio button next to Comma-Seperated Values (CSV). In the Path box, type the location of where to save the file to.
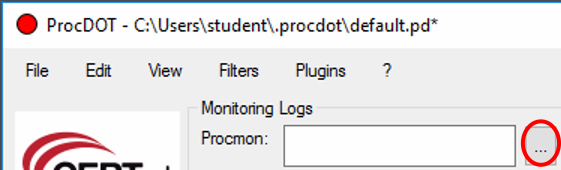
Step 3: Load Process Monitor CSV File in Procdot
In Procdot click the button with the ... to the right of the Procmon box.
In the popup window, select the CSV file you saved in step 2.
Step 4: Configure Options
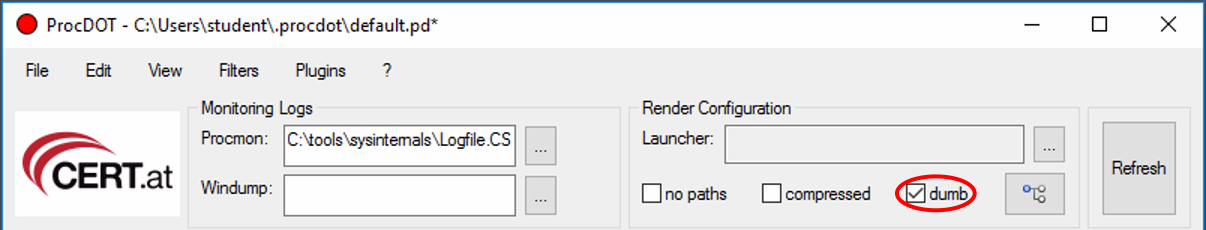
Under Render Configuration check the box next to dumb. If want to select additional options, click the button with the tree icon (just to the left of the Refresh button.)
If you're curious, hovering over each option will show a tooltip giving you more information.
Step 5: Generating a Graph
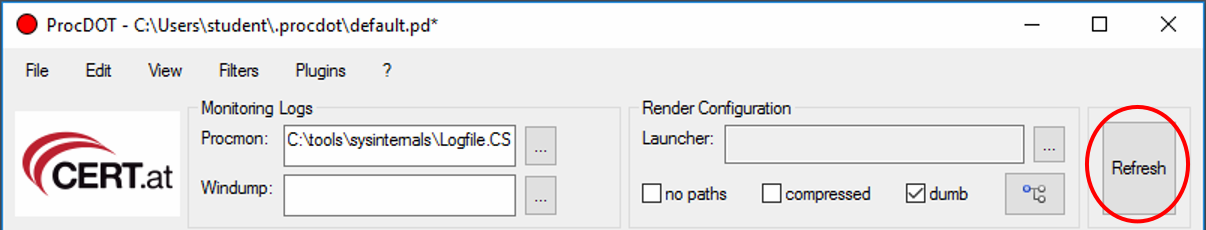
To render a graph, click the Refresh button at the top.
Tip
If the graph stays all black, make sure the box next to dumb is checked. You might also need to go back to Process Monitor and filter out some of the events.
Normal Mode and Frame Mode
Procdot operates in two modes: normal and frame. In normal mode, all of the items are shown without reference to time.
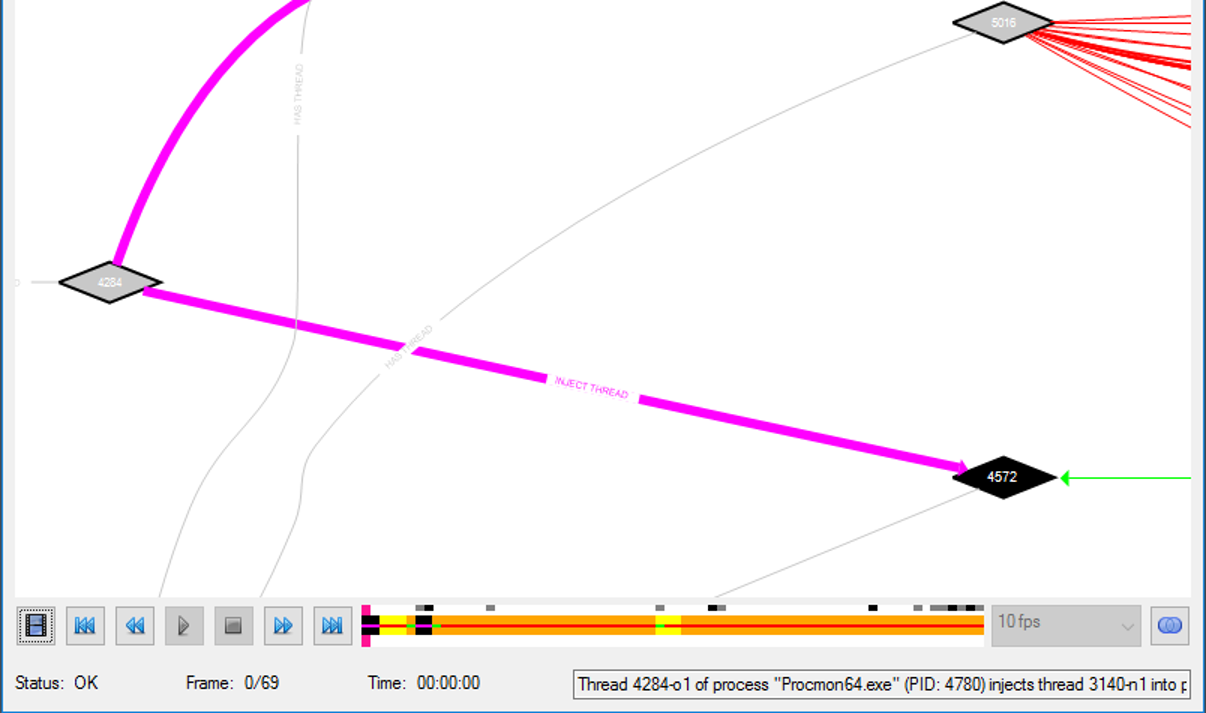
In frame mode, you can see when the events occur over time, almost like watching a movie. Events that are active at the current point in time are highlighted, and the rest are dimmed. To navigate the movie (and switch between normal and frame mode) use the navigation buttons at the lower left.
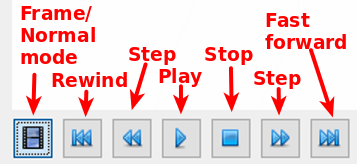
In frame mode you can use the navigation buttons to:
- Play through all events
- Step forward or backward one frame at a time
- Rewind to the begining or jump to the end
Interacting With the Graph
To move around the graph drag it by clicking and holding down the left mouse button while moving it.
To zoom in, while holding the Ctrl key scroll the mouse wheel up. If you only have a touch pad you can try using a two-finger scroll.
To zoom out, while holding the Ctrl key scroll the mouse wheel down. If you only have a touch pad you can try using a two-finger scroll.
You can get more details about a node by right-clicking on it and selecting Details.
Nodes
Nodes represent different items, depending on the shape. The color of the node represents when the node was created and the color of the text indicates if the item was alive or killed when the monitoring finished. Below is the meaning of the various nodes you will encounter:
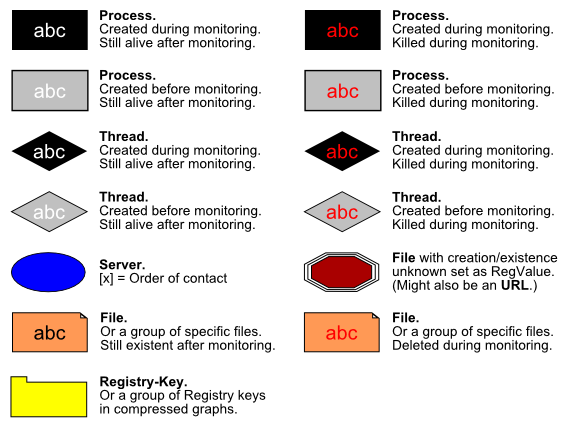
Alternatively you can see the definition for all of the nodes by clicking ? > Graph legend or hitting F1.
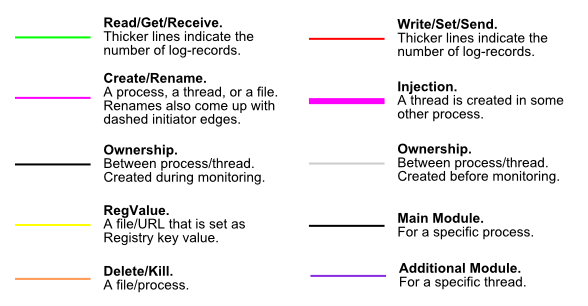
Edges
Edges represent different actions, depending on the color. Luckily most of the edges are labeled to describe the activity. However the color does matter. Below is the meaning of the various edges you will encounter: